
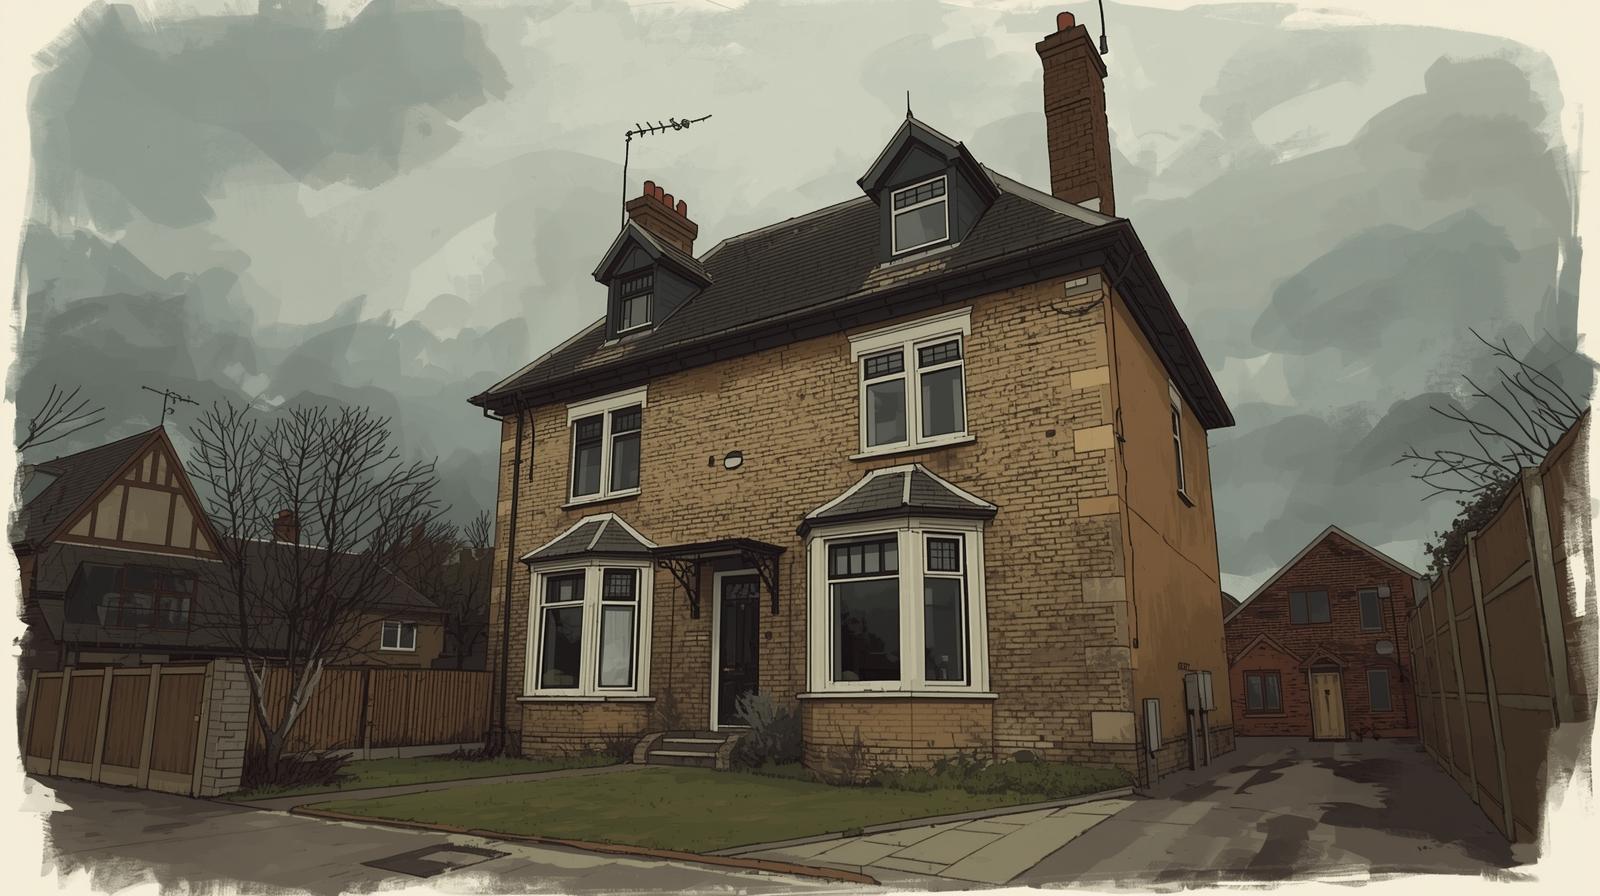
How to Spot an Overpriced Property (and Negotiate Smarter)
I’ve lost count of how many times I’ve walked into a viewing, checked the asking price, and thought, “Really? They want how much for this place?” Overpricing is everywhere in the UK property market, and if you’re not careful, it can quietly drain tens of thousands from your future returns.
The truth is, estate agents and sellers will often test the waters with ambitious figures. That’s not necessarily underhand, it’s human nature to hope for more, but it leaves buyers in a difficult position. Pay too much, and you start with a hole in your equity. Pay the right price, and you protect your return on investment from day one.
The good news? Spotting an overpriced property isn’t rocket science. By knowing what signs to look for and how to back your offer with solid evidence, you can negotiate from a position of confidence. In this guide, I’ll share the step-by-step process seasoned investors use to uncover true value, avoid the traps, and negotiate smarter.
Quick value snapshot (use before every offer):
- Compare last 6–12 months sold prices within 0.25–0.5 miles
- Compute £/sq ft and check variance (±10–15%) vs nearest comparables
- Run gross & net yield; sense-check against area average
- Add ALL costs (lease, service, ground rent, renovation, fees)
- Note time-on-market and any price cuts/relistings
Table Of Contents
- Why Spotting Overpriced Property Matters
- Signs a Property May Be Overpriced
- Land Registry & HMRC Price Index
- Calculating True Value Like an Investor
- Negotiation Tactics That Actually Work
- Common Mistakes Buyers Make When Negotiating
- Step-by-Step Checklist for Spotting and Negotiating
- Final Thoughts: Confidence Over Guesswork
- FAQs

Why Spotting Overpriced Property Matters
The Cost of Overpaying: Equity and ROI at Risk
When you overpay for a property, you’re not just losing a bit of cash, you’re cutting into your long-term returns. If you buy a £250,000 flat that’s truly worth £230,000, you’ve effectively started with a £20,000 hole in your equity. That’s money you won’t see again until the market catches up. For landlords, this also skews rental yield calculations. A yield that looked like 6% on paper might actually be closer to 5% once you factor in the inflated purchase price. Overpaying squeezes every metric that matters.
Overpriced Homes in a Cooling vs Rising Market
Market conditions matter too. In a rising market, overpaying can sometimes be absorbed if prices continue climbing, though that’s hardly a guarantee. In a cooling market, however, overpaying is brutal. You could find yourself in negative equity within months, watching neighbouring properties list for less than you paid. That’s why professional investors always anchor their decisions in evidence, not hope. They’d rather walk away than rely on the market to bail them out.
Emotional vs Financial Decisions
The biggest trap for homebuyers is emotion. It’s easy to fall in love with a bay window, a landscaped garden, or the “feel” of a street. Sellers know this, and some will set inflated prices banking on someone getting carried away. Investors, by contrast, approach every deal with cold logic. They don’t care about the paint colour, they care about cash flow, comparables, and long-term demand. Learning to switch from emotional buyer to financial strategist is the single most important step you can take to avoid overpaying.
Signs a Property May Be Overpriced
Spotting an overpriced property isn’t about gut instinct – it’s about stacking up clues until a clear picture emerges. Estate agents may talk about “what the market will pay,” but as buyers and investors, we need harder evidence. Here are the red flags I always look for.
Asking Price vs Sold Price Data (Land Registry, HMRC, portals)
The first and most obvious sign is when the asking price sits far above recent sold prices. Sites like the Land Registry, HMRC’s House Price Index, and even portals such as Rightmove and Zoopla provide real data on what homes have actually sold for, not just what sellers hope to achieve. If a three-bed terrace is listed at £300,000 but similar homes on the same street sold last month for £260,000, you’ve got a clear sign of overpricing. Agents may argue “this one’s special,” but numbers rarely lie.
- Use closest geography first (same street/estate), then widen in 0.25–0.5 mile steps.
- Match property type (terrace vs semi vs flat), beds/baths, and era (Victorian vs 1990s).
- Adjust up/down for condition, outside space, parking, and lease length (for flats).
How Long Has It Been on the Market?
Time on market tells its own story. A property that’s been listed for six months or more is often overpriced. Serious buyers have already seen it and walked away. Unless there’s a highly unusual circumstance, the market tends to punish inflated pricing with stagnation. That “stale” listing smell is a big negotiation lever for investors.
Frequent Price Reductions and Relistings
Related to this, multiple price cuts scream overpricing. If the seller starts at £350,000, drops to £330,000, then again to £310,000, it suggests unrealistic expectations from the outset. Some agents even relist homes to reset the “days on market” counter, but savvy buyers will spot the recycling. A zigzagging price history is rarely a good sign.
Comparing “Price per Square Foot” with Similar Homes
One of the most powerful tools in my kit is price per square foot. It strips away emotion and allows a direct comparison between homes of different sizes. If the local average is £280 per square foot and the property you’re viewing works out at £340, you’ll want a strong justification. Premium finishes or a prime street can explain a little uplift, but anything beyond 10–15% should set alarm bells ringing.
Use our price per square foot calculator or our price per square meter calculator and then compare it to the average price per square foot for counties in the UK.
Cosmetic Touch-Ups Hiding Deeper Issues
Fresh paint, new carpets, and shiny staging can dazzle, but sometimes it’s a smokescreen. I’ve seen properties where a lick of paint was hiding damp, or new flooring was covering uneven substructures. If the cosmetics look rushed or out of sync with the overall condition, question why. An inflated asking price combined with superficial upgrades is a classic tactic to distract buyers from underlying flaws.
- Fixable: tired décor, old appliances, basic landscaping.
- Red flags: patchy paint over damp, musty lofts, persistent condensation, uneven floors, hairline cracks near lintels.
Lease Length, Service Charges, and Other Hidden Costs
For flats, it’s not just about the headline price. Short leases, high service charges, and restrictive ground rents can make a seemingly “fairly priced” property expensive in reality. For example, a flat at £250,000 with a lease under 80 years can be far less valuable than one with a 120-year lease, yet sellers often ignore this when setting prices. Always factor in these hidden costs before judging whether an asking price makes sense.
Location Red Flags: Busy Roads, High Crime, Poor Schools
Finally, location is everything. A home overlooking a dual carriageway, sitting in a crime hotspot, or outside the catchment of decent schools should not command the same premium as similar homes in quieter, safer streets. Yet many sellers try to push values regardless. This is where Propertistics-style data is invaluable: cross-checking crime rates, Ofsted ratings, and local amenities gives you a sharper sense of whether the asking price matches reality.
Tools & Data Sources for Checking Property Value
If you’re serious about spotting overpricing, you need to ground your decisions in reliable data. Thankfully, the UK offers some of the most transparent property information in the world, you just have to know where to find it.

Land Registry & HMRC Price Index
The Land Registry is the gold standard for sold prices. It records every completed transaction in England and Wales, giving you hard evidence of what buyers are really paying. Pair that with HMRC’s UK House Price Index, which tracks regional and national trends, and you’ll see whether an asking price is aligned with the wider market or floating in fantasy land.
Propertistics, Rightmove, Zoopla & OnTheMarket Price Histories
The major portals aren’t just good for browsing listings, they’re powerful research tools. Rightmove and Zoopla, for instance, show historical asking prices and changes over time. If a property has been reduced multiple times, it’s a warning sign. OnTheMarket also gives insight into how long a home has been listed. Together, these portals reveal the seller’s pricing strategy and whether the market has already rejected it.
With that being said, Propertistics has every single house sale ever made and you can look at house sales by area, by postcode, by property type or even by single property in one place with ease to help your property research.
- Capture: first list date, every price change, and current days-on-market.
- Compare: days-on-market vs area median (slow vs hot segments).
Local Council Planning Portals (future developments)
Price isn’t only about today – it’s about tomorrow. Local authority planning portals reveal what’s coming down the pipeline: new transport links, regeneration projects, or large housing developments. A property might seem overpriced now, but if it’s near a future train station or retail hub, the premium could be justified. Equally, a quiet street might lose value if a major development looms nearby. Planning data helps you spot both risks and opportunities.
Propertistics Area Reports
This is where I cut through the noise. Propertistics pulls all the key metrics – crime rates, school performance, demographics, average prices, rental yields, even local amenities, into a single, easy-to-digest report. Instead of juggling five or six different sites, I can see the full picture instantly. For buyers and investors, it’s not just a time-saver; it’s a way to negotiate with confidence, armed with hard evidence the seller can’t argue with.

Calculating True Value Like an Investor
Spotting an overpriced property is one thing; proving it with numbers is another. This is where investors set themselves apart from ordinary buyers. Instead of fixating on what a property looks like, we calculate what it can earn and whether the asking price makes financial sense.
Comparing Rental Yield vs Asking Price
Rental yield is the first lens I use. If the asking price feels ambitious, I check whether the rental market justifies it. Take two flats both renting for £1,200 per month: one listed at £200,000 and the other at £250,000. The first offers a 7.2% gross yield; the second only 5.7%. Unless the pricier flat has stronger long-term growth drivers, the cheaper one makes far more sense.
Gross vs Net Yield Examples (worked calculations)
Gross yield is simple: annual rent ÷ purchase price × 100. Using the £250,000 flat example:
Rent: £1,200 × 12 = £14,400
Yield: £14,400 ÷ £250,000 × 100 = 5.76% gross yield.
But gross figures don’t tell the full story. Let’s deduct £1,200 a year in service charges, £1,000 for maintenance, and £1,200 for letting fees. That’s £3,400 in annual costs. Net rent falls to £11,000, meaning the true yield is 4.4%. A property that looked average suddenly looks overpriced once costs are factored in.
Factoring in Renovation & Maintenance Costs
Investors also account for the “hidden” costs of getting a property up to standard. A flat needing £15,000 of renovation isn’t really a £250,000 purchase, it’s £265,000. When calculating value, I always add these upfront and ongoing costs to the headline figure. Sellers love to gloss over tired kitchens or outdated wiring, but ignoring them can distort ROI by thousands.
- Cosmetic (fast wins): paint, flooring, lighting (<£5–10k).
- Systemic (capex): roof, wiring, boiler, windows (£5–£20k+).
- Layout/space: adding bedroom/ensuite, open-plan (planning dependent).
Discounted Cash Flow & Long-Term Growth Potential
Finally, the sharpest investors think in terms of discounted cash flow (DCF). This means projecting future rental income, subtracting likely expenses, and then discounting those cash flows back to today’s value. It’s more advanced, but even a simple version is eye-opening. A property generating steady income in a growth area may be “worth” paying close to asking, while the same yield in a stagnant town isn’t. Always weigh short-term yields against long-term appreciation prospects.

Negotiation Tactics That Actually Work
Even if you’ve identified an overpriced property, the battle isn’t won until you negotiate a fairer price. This is where many buyers lose their nerve, but the truth is, negotiation isn’t about being pushy, it’s about being prepared. Armed with the right data and mindset, you can save thousands and walk away with confidence.
Doing Your Homework: Evidence Beats Opinion
The strongest weapon you have in a negotiation is hard evidence. Walking into an offer discussion with “I think it’s too expensive” gets you nowhere. Turning up with Land Registry sold prices, yield comparisons, and even local crime or school data changes the dynamic. Sellers and agents might disagree with your opinion, but they can’t argue with facts. I’ve found that showing printed comparables on the table often cuts straight through the sales pitch.
Timing Your Offer (seasonality, days on market)
Timing is everything. Properties listed in the spring frenzy often attract higher prices, while homes that linger through autumn and winter usually see reduced demand. Likewise, a property that’s been sitting on the market for six months is ripe for a lower offer, the seller’s patience (and possibly finances) are running thin. Ask the agent how long the property’s been listed, and you’ll instantly know how much leverage you have.
Framing Your Offer: Anchoring & Incremental Bids
Negotiation isn’t just about numbers – it’s about psychology. Anchoring is a powerful tactic: start lower than your true ceiling, then move up incrementally. For instance, if you’re aiming to pay £230,000 for a £250,000 property, open at £220,000. Each small step upward signals compromise, while still guiding the discussion towards your target. Agents expect movement, use it to your advantage, not theirs.
Using Property Flaws as Leverage
Every imperfection is an opportunity. Outdated kitchens, peeling paint, short leases, or noisy roads aren’t just cosmetic issues, they’re bargaining chips. The key is to highlight flaws as additional costs you will have to bear. Framing it as, “I’ll need to budget £10,000 to bring this up to standard” justifies a lower offer without insulting the seller. It’s logic, not lowballing.
- Short lease / absent share of freehold
- High service charges or rising sinking fund
- Nearby development affecting light/parking/noise
- Energy inefficiency (EPC) impacting running costs
Handling Counteroffers Like a Pro
Counteroffers are part of the dance. Don’t panic when the seller pushes back. Instead, stay calm and reframe the conversation around your evidence. If they come back with £245,000 when you’ve offered £230,000, respond with your comparables: “Similar homes sold for £228,000 and £232,000, my offer reflects the true market.” By keeping emotion out of it and circling back to the data, you maintain credibility.
Knowing When to Walk Away
The hardest but most powerful tactic? Walking away. Some sellers simply won’t budge, and no amount of negotiation will bridge the gap. That’s fine. There will always be another property, and overpaying out of fear of missing out is the quickest way to regret. I remind myself: walking away doesn’t mean losing, it means preserving capital for the deal that truly stacks up.
Common Mistakes Buyers Make When Negotiating
Even with the best intentions, it’s easy to trip up when you’re negotiating on property. I’ve made some of these mistakes myself in the early days, and I’ve watched plenty of buyers overpay because they didn’t spot the traps. Here are three of the most common.
Falling in Love with a Property
The moment you get emotionally attached, you lose leverage. Sellers and agents can sense it, the wide eyes, the “we love this house” comments, the eagerness to make an offer. Suddenly, every flaw gets overlooked and every counteroffer feels acceptable. Property is an investment first and foremost. By keeping emotion in check, you maintain the ability to walk away, and that’s the strongest position of all.
Ignoring Data in Favour of Agent Hype
Estate agents are skilled at painting a picture. They’ll talk up “incredible potential” or claim “we’ve had lots of interest.” Without data, it’s easy to get swept along. The mistake is taking their word at face value rather than checking comparables, yields, and time-on-market figures yourself. The numbers either back up their story – or they don’t. Rely on facts, not hype.
Revealing Your Budget Too Early
One of the fastest ways to lose negotiation power is blurting out your budget. If you tell an agent you can “stretch to £250,000,” guess where negotiations will land? The seller will anchor to your ceiling, not the property’s value. Instead, focus discussions on the property, not your finances. Keep your upper limit private and negotiate with evidence, not emotion.
Say this: “We’re guided by local completions and required works. If the numbers line up, we can move quickly.”
Step-by-Step Checklist for Spotting and Negotiating
When I’m assessing a property, I run through the same checklist every time. It keeps me focused on the facts and gives me confidence when it’s time to make an offer. Here’s a framework you can follow:
✅ Compare asking prices with recent sold prices (Land Registry, HMRC, portals)
✅ Check how long the property has been on the market
✅ Look for price reductions or relistings that signal overpricing
✅ Calculate price per square foot against similar local homes
✅ Inspect for cosmetic upgrades masking deeper issues
✅ Review lease length, ground rent, and service charges on flats
✅ Research local schools, crime rates, and amenities
✅ Evaluate rental yields and net returns vs the asking price
✅ Factor in renovation and maintenance costs before committing
✅ Gather planning data on future developments nearby
✅ Use flaws as leverage points in negotiation
✅ Never reveal your true budget or emotional attachment
Follow this list and you’ll approach every viewing like an investor, not a hopeful buyer. The difference shows in your results and your bank balance.
Download idea: turn this checklist into a printable one-pager and link it here for higher engagement and dwell time.
Final Thoughts: Confidence Over Guesswork
Overpriced properties are everywhere, and without the right tools, it’s all too easy to get caught out. But when you swap guesswork for data, you shift the odds in your favour. Instead of hoping you’ve made the right decision, you know you have because the numbers back you up.
Negotiating from that position is liberating. You’re no longer the nervous buyer trying not to miss out; you’re the confident investor, prepared to walk away unless the deal truly stacks up. That mindset alone can save you thousands.
If you’d rather not spend hours juggling different websites and spreadsheets, Propertistics reports bring everything together crime rates, school performance, yields, prices, and more, in one clear view. It’s the shortcut that helps you spot overpricing instantly and negotiate with evidence that sellers can’t ignore.
FAQs
1. How can you tell if a house is overpriced in the UK?
Compare the asking price with recent sold prices from the Land Registry or HMRC. If similar properties nearby sold for less, that’s a clear warning sign. Also check how long it’s been on the market, if it’s sitting unsold for months, it’s likely priced too high.
2. What happens if I overpay for a property?
Overpaying erodes your equity from day one. If you buy at £250,000 but the true market value is £230,000, you start £20,000 in the red. This lowers your ROI, weakens yields, and can leave you exposed if the market cools.
3. How do estate agents price properties?
Agents usually base prices on comparable sales, local demand, and seller expectations. Some, however, inflate values to win instructions from sellers. That’s why checking sold prices yourself is essential.
4. Can I still negotiate on a property if it’s just been listed?
Yes, but it’s harder. Sellers are usually less flexible in the first few weeks. If the property is priced ambitiously, you may have more leverage after 30–60 days on the market.
5. What is a fair offer to make on an overpriced house?
It depends on the evidence. If similar homes sold for £220,000 and the asking price is £240,000, offering around £220,000–£225,000 is fair. Always base offers on comparables, not wishful thinking.
6. Is it worth buying an overpriced property in a regeneration area?
Sometimes. Regeneration can justify a higher price if it will clearly boost demand and values in the near future. But pay too much upfront and you risk waiting years before growth catches up.
7. What’s the best website to check UK house prices?
The Land Registry is the most accurate for sold prices. HMRC’s House Price Index shows trends. Portals like Rightmove and Zoopla reveal asking price history. Propertistics pulls all this together in one report for faster analysis.
8. How much below asking price can I realistically offer?
In slower markets, 5–10% below asking is common, and sometimes more. In hot markets, offers closer to asking are expected. Your leverage depends on demand, property condition, and time on market.
9. Do overpriced homes eventually sell?
Usually, yes – but often after price reductions. Some sellers refuse to adjust, and those homes stagnate. Overpriced properties that linger often end up selling for less than they might have achieved if priced fairly from the start.
10. How do investors spot undervalued properties instead?
Investors hunt for motivated sellers, short leases, homes needing renovation, or areas with strong yields but modest asking prices. They use data, yields, comparables, and growth trends to find value where others don’t see it.


